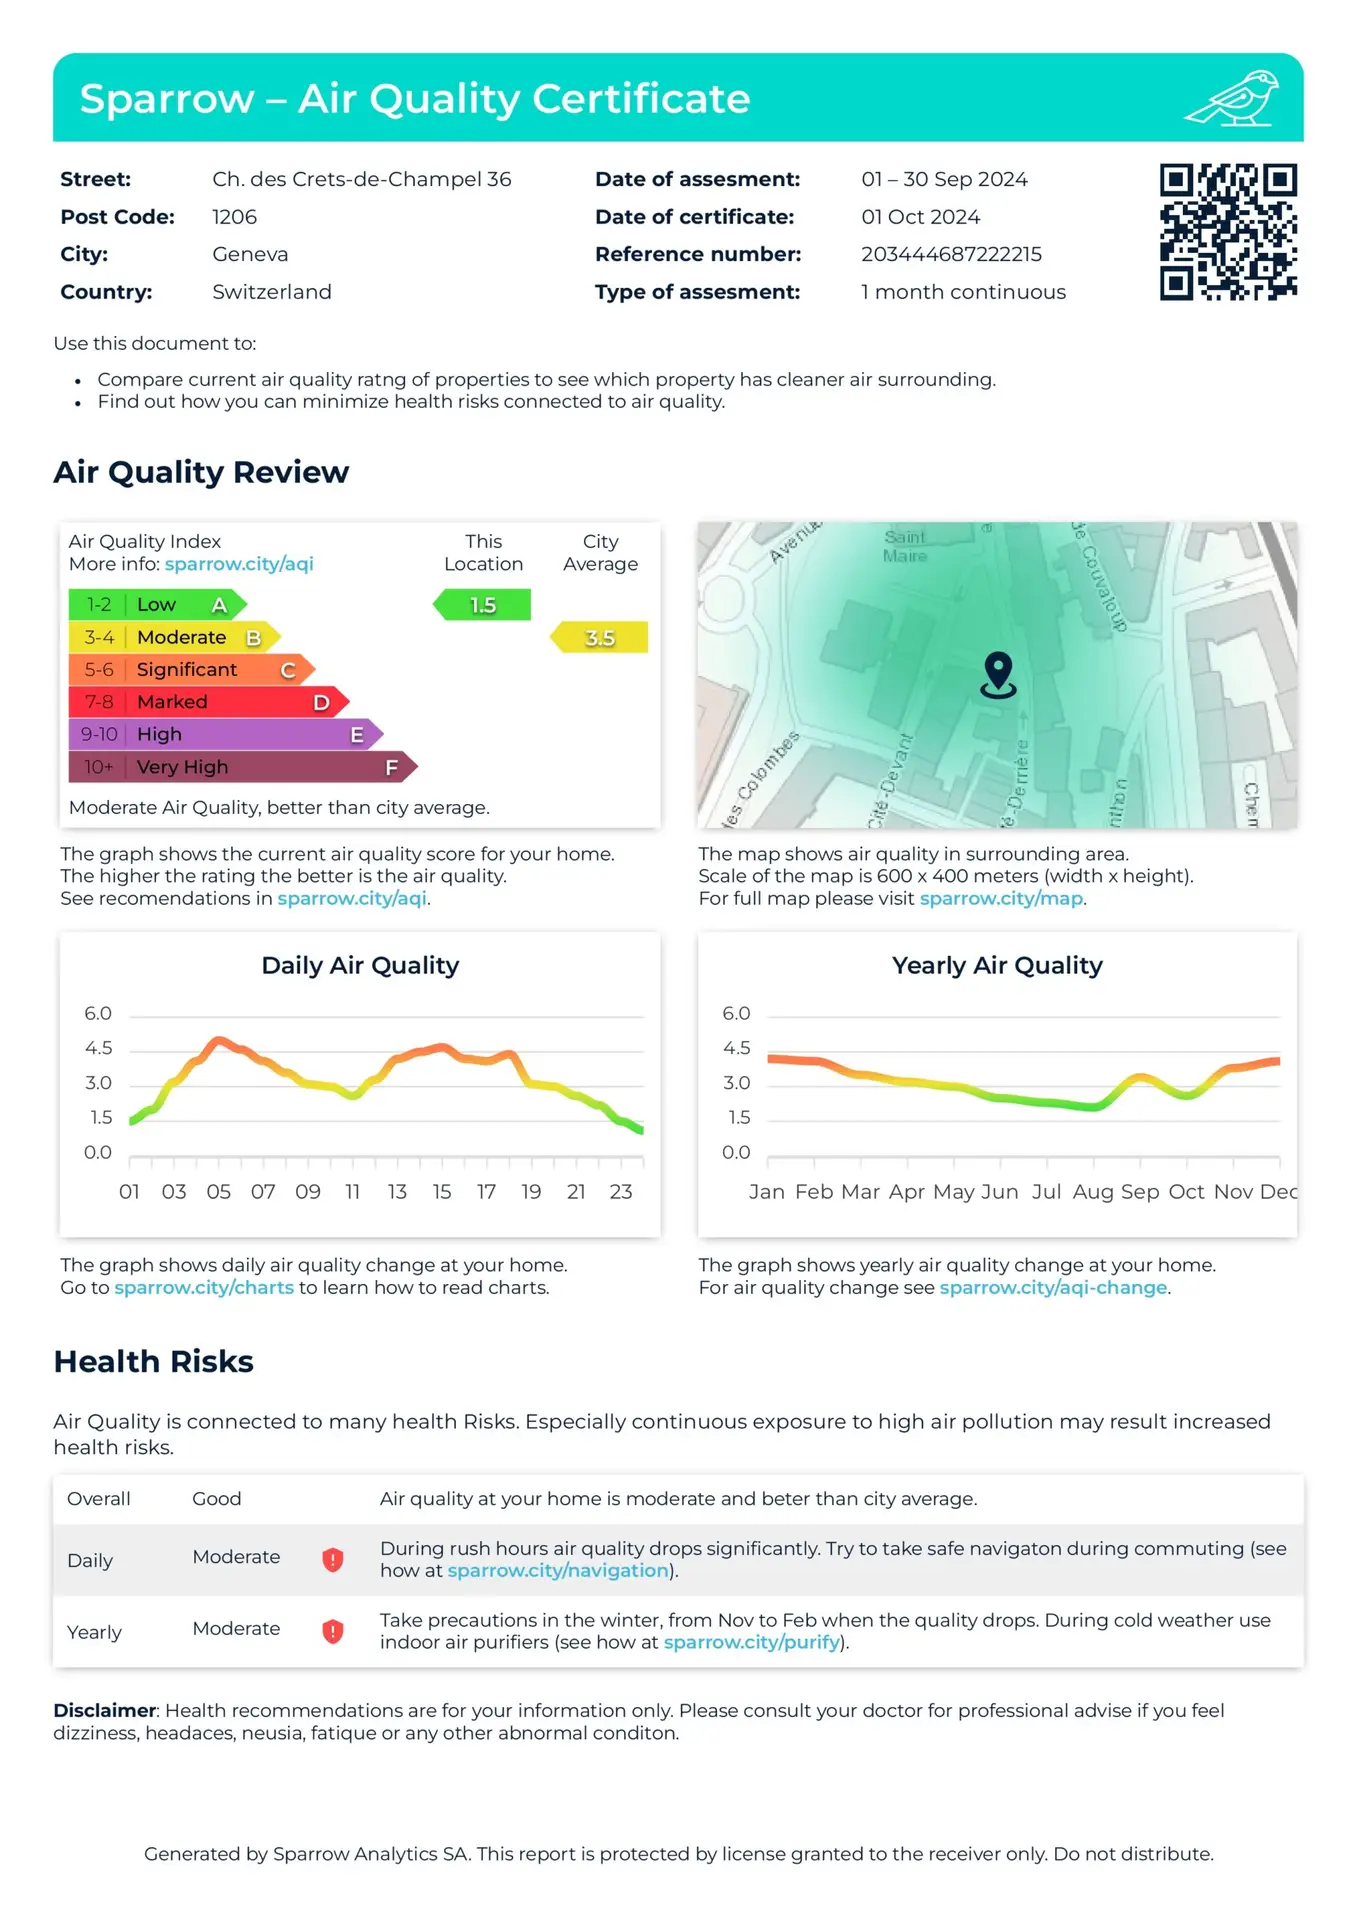
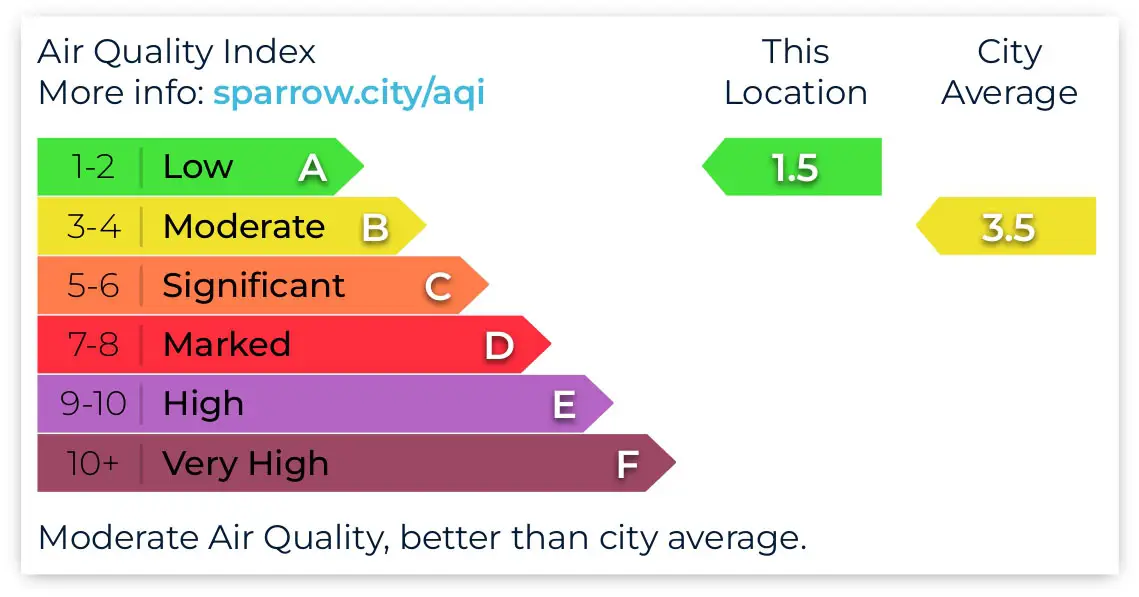
Understand the air quality at your location with our detailed AQI analysis. Compare your property’s air quality with city averages and discover how your environment measures up.

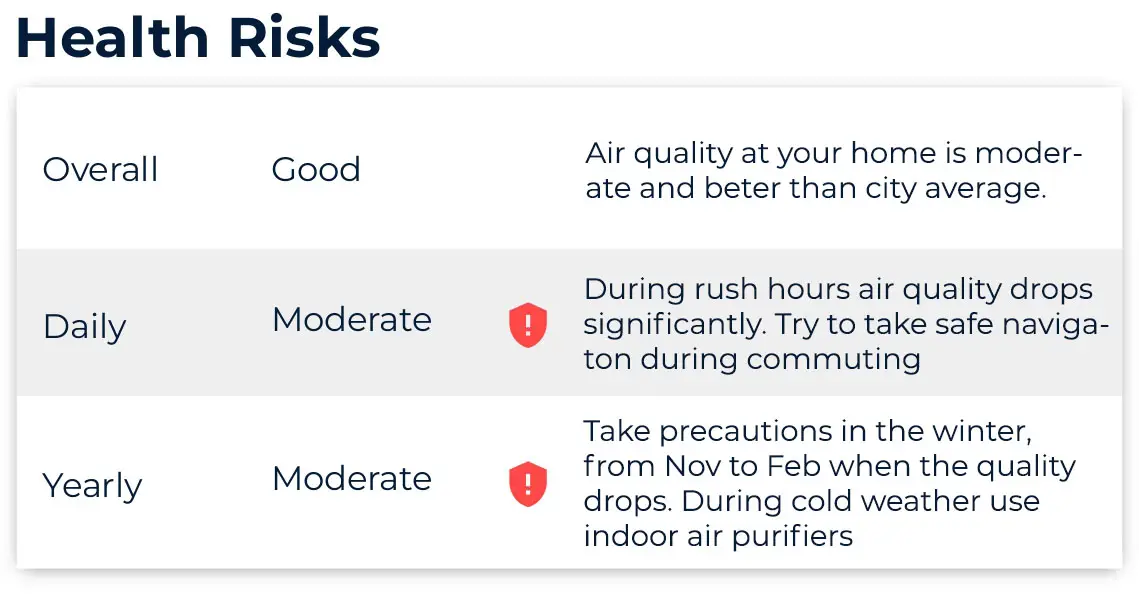
Learn about the potential health risks associated with air quality at your location. Our certificate provides tailored recommendations to minimize exposure to harmful pollutants, ensuring that you and your loved ones stay safe
Our certificates include intuitive graphs and maps that visualize air quality trends and health risks. These visuals make it simple to understand the data and take appropriate action.
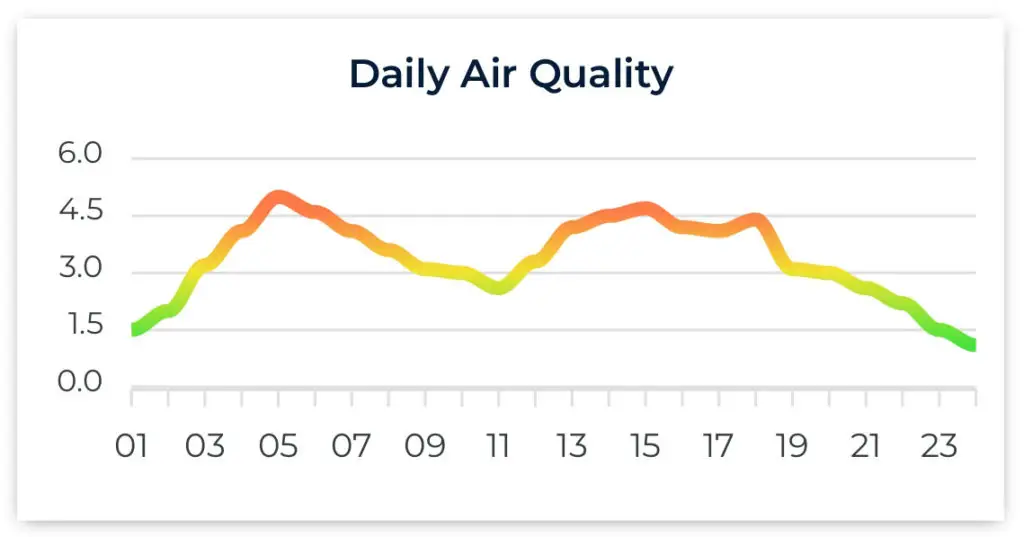
Track how air quality fluctuates over time with our seasonal and daily trend analysis. This feature allows you to anticipate and prepare for periods of poor air quality, whether daily during rush hours or seasonally during colder months.
Beyond just data, we provide actionable recommendations to help you mitigate any risks associated with poor air quality. These personalized tips empower you to create a safer environment for yourself and your loved ones
“Our certificate shows that your home enjoys a moderate air quality rating, better than the city average. You’ll also receive visual representations through graphs and maps, making it easy to comprehend your environment’s air quality.


Our certificate highlights that air quality typically drops in winter from November to February, prompting you to take extra precautions.
If air quality drops during rush hours, our report suggests safer commuting times. During colder months, when air quality typically declines, we recommend using indoor air purifiers.


